A machine can feel great on a demo day. The cab is clean, the hydraulics are crisp, the dealer rep is smiling. But that feeling doesn't tell you what happens at 150 hours when the ambient hits 110°F and the undercarriage starts to wear.
That's why I built a fixed protocol. Every machine that comes through my test yard gets the same treatment—same loop, same samples, same metrics. No exceptions. This is how I separate signal from noise.
1. Baseline: Where Every Machine Starts
Before a machine does a single hour of work, I spend a full day documenting it.
Visual inspection: Every component photographed. Undercarriage measurements taken with calipers—track sag, pin wear, bushing thickness. Bucket teeth measured. Hoses and fittings noted.
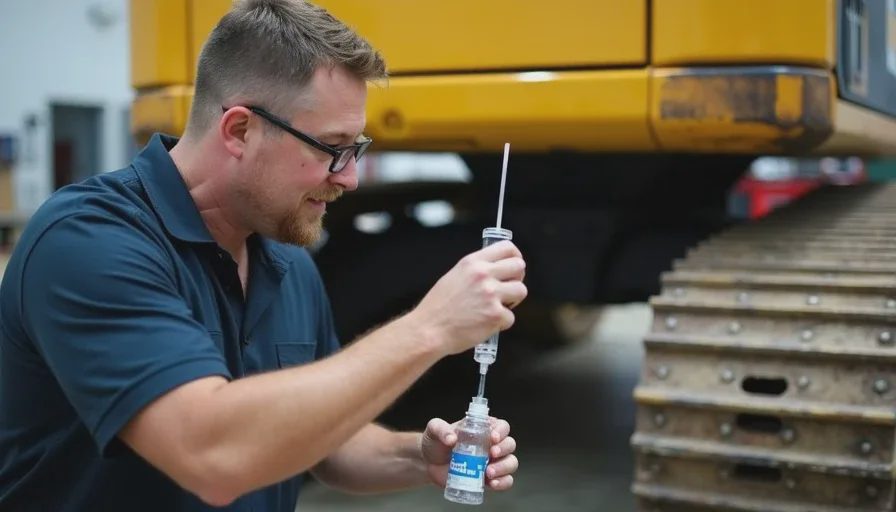
Fluid sample: Engine oil, hydraulic oil, and final drives sampled at hour zero. Sent for viscosity, particle count, and spectral analysis (wear metals). This gives me the "fingerprint" of a new or freshly serviced machine.
Performance test: Where possible, a hydraulic flow and pressure test at the main pump. A baseline dyno run if the machine has a PTO or auxiliary circuit. I record cycle times for a standardized digging or lifting sequence.
Documentation: All data entered into a spreadsheet with the machine's model, serial number, initial hours, and test dates.
This baseline tells me where the machine should be. Everything after that is measured against this starting point.
2. The 200‑Hour Operating Cycle
The machine runs for 200 hours on my test loop—a marked course on my five acres that includes:
Excavation passes in Arizona hardpan clay (abrasive, high-impact)
Lifting and swinging cycles to stress the hydraulic system
Travel sections on uneven ground to work the undercarriage
Loading sequences with a standard material weight
I run at least 30% of those hours myself. Other operators handle the rest—but I'm in the cab enough to feel what the machine is doing. I log ambient temperature, humidity, and any unusual behavior. No babying, no abuse. Just real work.
The 200‑hour mark is not arbitrary. It's the point where break-in wear has settled, but long-term wear patterns are just starting to show. It's the earliest moment you can predict what will happen at 2,000 hours.
3. Fluid Sampling Schedule
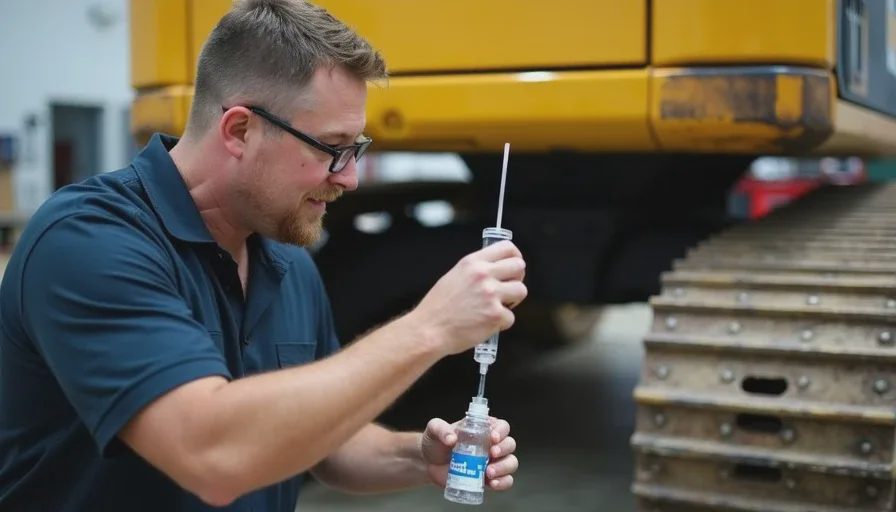
Fluid analysis is the single most honest thing you can do to a machine. I sample at three intervals:
Interval | What I Measure |
|---|---|
50 hours | Viscosity, particle count, wear metals (iron, copper, lead, silicon, etc.). First sign of contamination or abnormal break-in wear. |
100 hours | Same panel. Trending begins. A spike in silicon tells me the air filter is failing or there's a dirt ingress. A spike in copper points to bushing wear. |
200 hours | Full panel plus TAN (total acid number) and water content. I also compare against the baseline sample to see how much the oil has degraded. |
If any sample flags a critical warning (e.g., particle count over ISO 18/15/12 or a sudden jump in a specific metal), I pull an extra sample at 25‑hour intervals until I identify the source. I never wait for the next scheduled sample if the data looks wrong.
4. Teardown Criteria
I don't tear down every machine. I tear down machines where the data says something interesting is happening.
Unscheduled failure: If a component fails before 200 hours, I tear it down completely. I photograph every part, measure wear surfaces, and diagnose the root cause. That failure becomes a major part of the report.
Exceptional wear metals: If the 200‑hour fluid sample shows wear metals more than 2x above typical for that machine class, I pull the suspect component and inspect it internally.
Performance degradation: If cycle times slow by more than 10% from baseline, I inspect the pump and valves.
When I do a teardown, I document it with high-resolution photos and detailed notes. This isn't just a "passed/failed" test—it's a forensic examination.
5. Cost‑Per‑Hour Calculation
This is the metric that matters most to fleet managers and owner‑operators. I calculate Total Cost Per Operating Hour using this formula:
text
复制
下载
( Fuel cost + Filter/fluid cost + Unscheduled repairs + Estimated depreciation for 200 hours ) / 200 hoursFuel cost: Actual gallons consumed, measured at each fill, multiplied by local pump price.
Filter/fluid cost: All oil, filters, and greases used during the test.
Unscheduled repairs: Parts and labor for anything that broke. If I fix it myself, I bill my own time at a standard shop rate ($100/hr) to keep it realistic.
Depreciation: Not the full machine cost, but a straight‑line depreciation over the machine's expected life. For a new machine, I use the manufacturer's typical useful life. For a used machine, I use the purchase price divided by remaining expected hours.
At the end of 200 hours, I have a hard number: "This machine cost you X dollars per hour to operate."
That number includes everything except insurance, financing, and hauling—I keep it focused on direct operating costs so it's actionable.
6. Comparison Framework
When I compare two machines in the same class, I don't just stack their spec sheets. I stack the data from my test yard.
Side‑by‑side: Same loop, same operator rotation, same sampling schedule, same ambient conditions. I run them back‑to‑back, not simultaneously, but within the same two‑week window to ensure weather is similar.
Metrics compared: Fuel burn per hour, average cycle time, unscheduled repair count, cost per hour, fluid analysis trends (especially wear metals accumulation over 200 hours), and operator comfort feedback.
Normalization: I adjust for any differences in initial condition—if one machine has 50 hours more on the clock, I note that. I never pretend the comparison is perfectly equal; I just make it transparent.
Every comparison report includes a data card at the top: machine models, starting hours, test dates, ambient summary, and the raw cost‑per‑hour for each. Then the narrative walks through what the data means.
Why This Protocol Matters
A standardized protocol is the only way to make tests repeatable and trustworthy. If I changed the loop, the operator, or the sampling schedule for every machine, I'd have nothing but anecdotes. This protocol turns anecdotes into data.
It's not glamorous. It's not fast. But it's honest.
The iron doesn't lie—and neither does this test.

00 Transmissions
No transmissions yet. Yours opens the channel.